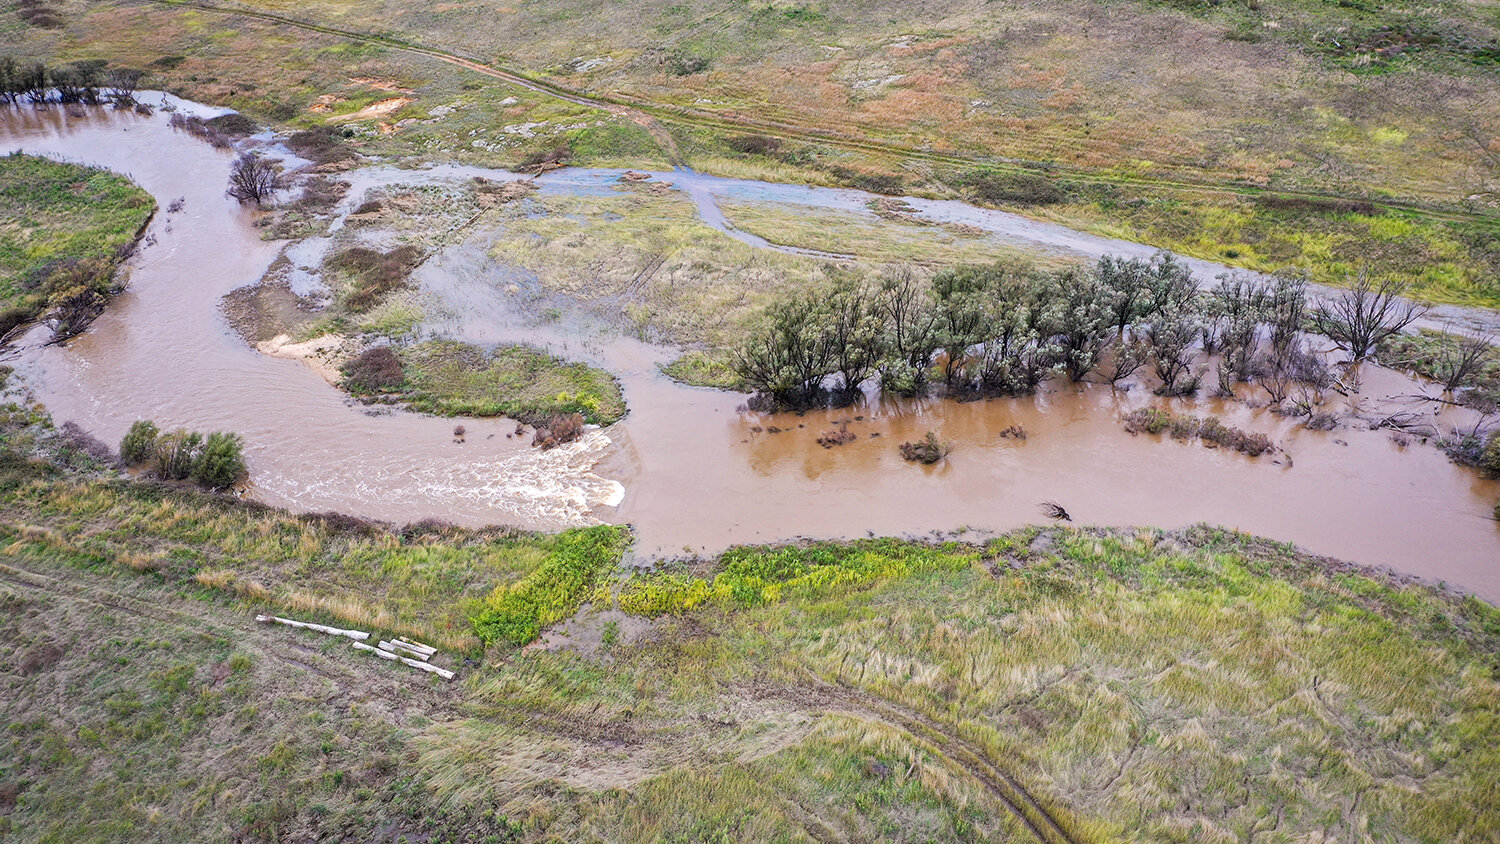
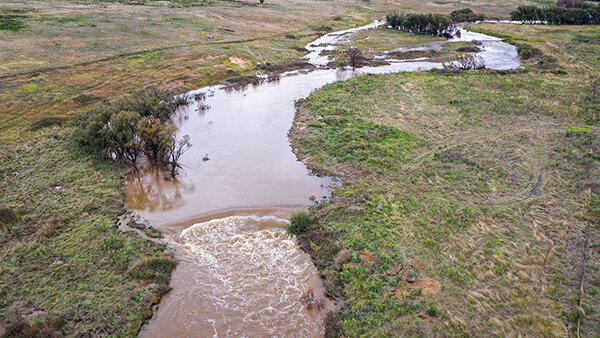
In late March 2021, another flood event occurred in the Mulloon catchment which amazingly means two ‘1-in-50-year’ flood events in little more than six months!
The water looks muddy because of erosion from the fire affected parts of the catchment upstream of the project area. However, again thousands of tonnes of silt was caught on the floodplain.
So, what did the stream gauges show us?
Structure DM6 looking upstream towards DM8, at Mulloon Creek Natural Farms.
Mid Mulloon gauge
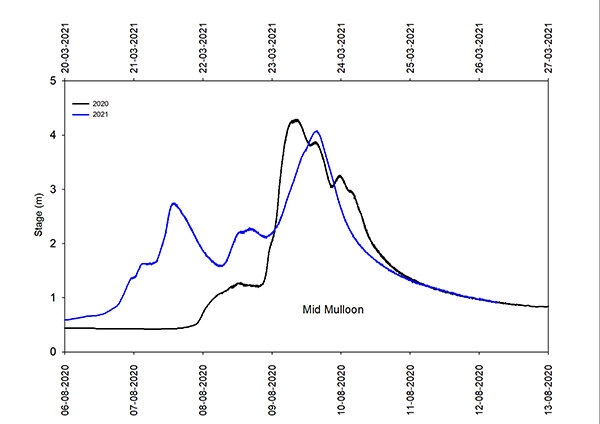
Mid Mulloon gauge
This graph demonstrates that the March 2021 flood didn’t peak quite as high as the 2020 flood at the ‘Mid Mulloon’ gauge but that the volume throughout the entire event was far greater.
Lower Mulloon gauge
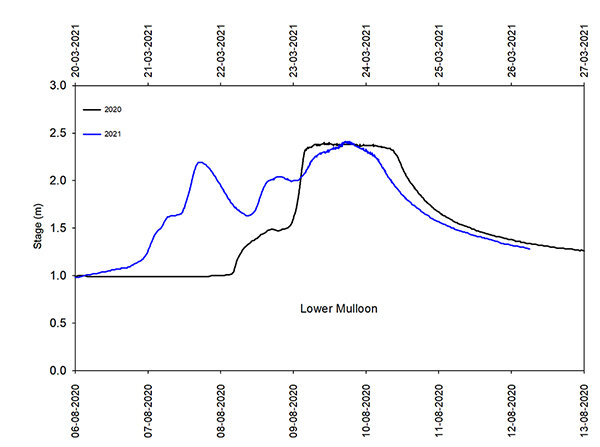
Lower Mulloon gauge
At ‘Lower Mulloon’, the water has overtopped the bank in both 2020 and 2021, which is why both curves flatten out, but the 2020 flood over banked for a longer period of time.
The slightly higher level at ‘Lower Mulloon’ in 2021 could be because there is now more grass along the banks and on the floodplain forcing the level higher in the channel.
This data forms part of the ongoing scientific monitoring for the Mulloon Rehydration Initiative which is jointly funded through the Mulloon Institute and the Australian Government’s National Landcare Program. The initiative is also assisted by the NSW Government through its Environmental Trust.